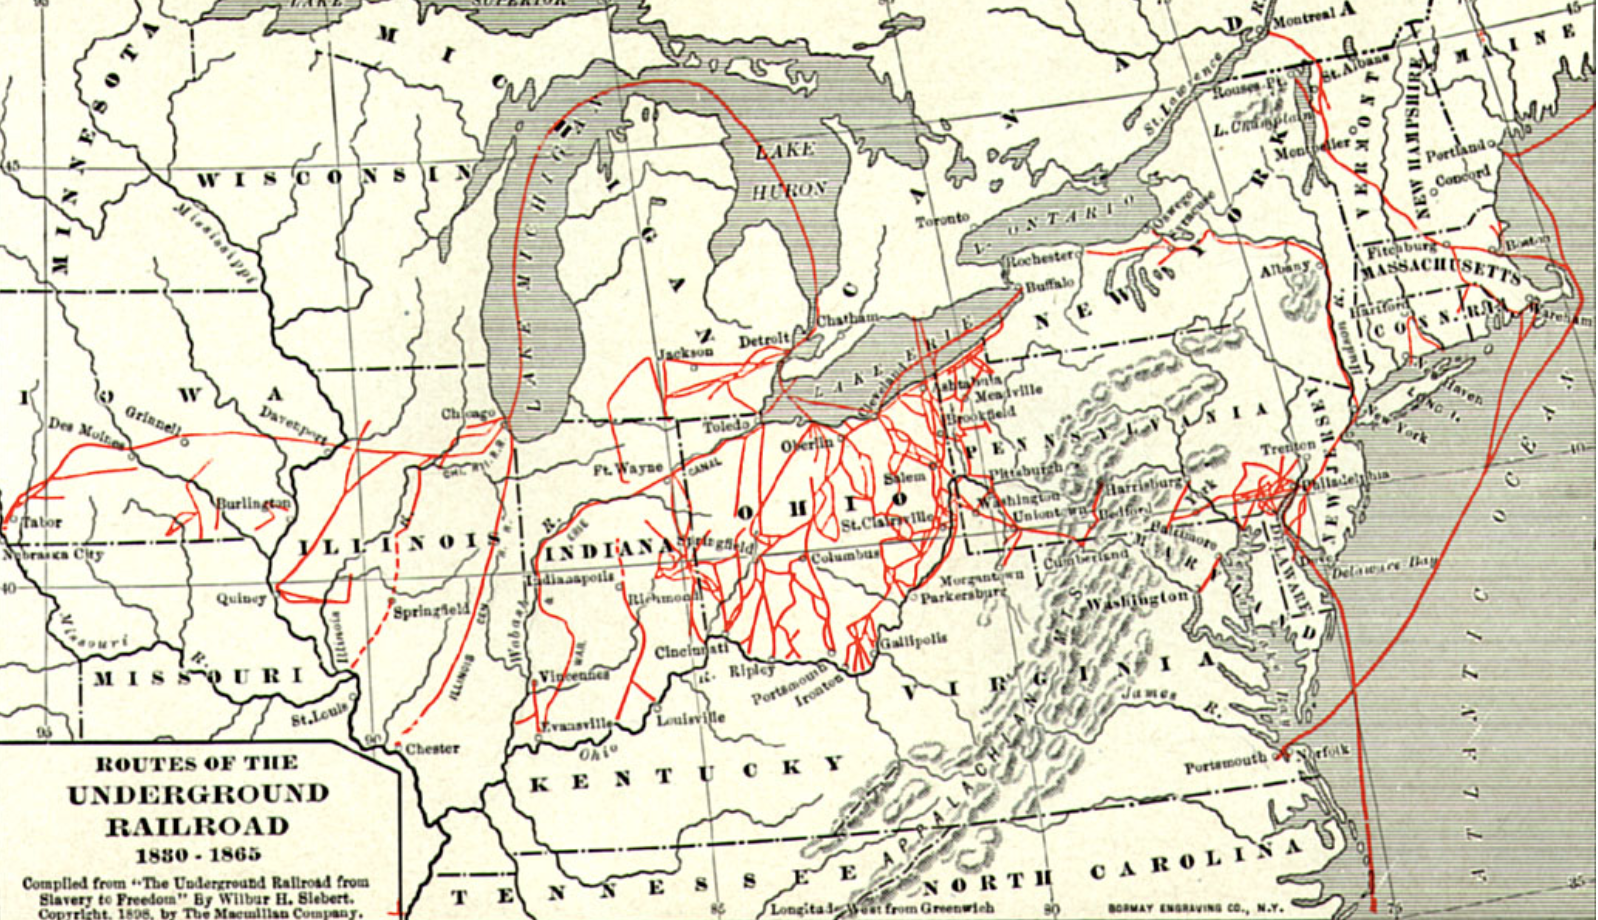
Banner image: Featured Underground Railroad “routes” map from Wilbur H. Siebert’s groundbreaking study, The Underground Railroad: From Slavery to Freedom (1898) (Ohio History)
Vigilance Maps
Philadelphia Vigilance Committee (William Still’s journal)
The GIS map below created by Cooper H. Wingert helps visualize records from the Philadelphia Vigilance Committee and maintained by William Still documenting 995 freedom seekers during the 1850s. The radial lines illustrate the origins of the freedom seekers and their convergence at the Anti-Slavery Office at 31 N. Fifth Street in Philadelphia. Data compiled by William C. Kashatus and James A. McGowan. Originally published in William Still: The Underground Railroad and the Angel at Philadelphia (Notre Dame University Press, 2021), pp. 221-280.
Record of Fugitives (Sydney Howard Gay’s journal)
The GIS map below created by Cooper H. Wingert helps visualize New York vigilance records maintained by abolitionist Sydney Howard Gay in 1855 and 1856 in his Record of Fugitives. Data drawn from Columbia University Libraries online exhibit and Eric Foner, Gateway to Freedom: The Hidden History of the Underground Railroad (New York: W.W. Norton, 2015).
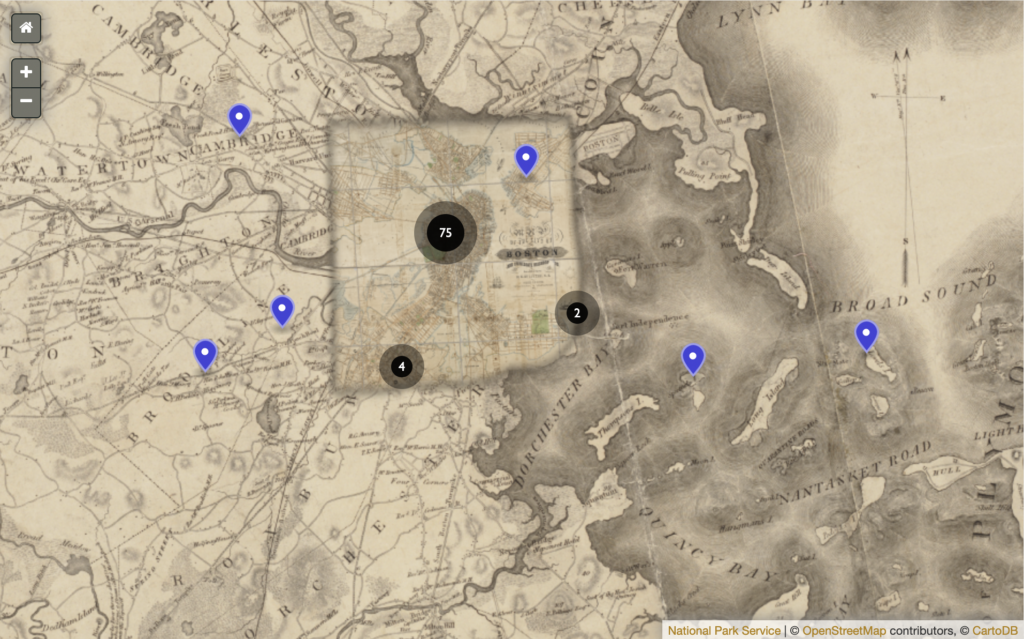
Boston Vigilance Committee
This GIS map of antebellum Boston was created for the National Park Service Boston African American website, highlighting Underground Railroad locations across the city, relying on records from the Boston Vigilance Committee and other sources. Clicking on the map below will exit this website and enter the NPS “Mapping the Underground Railroad in Boston” page.
Stampede Maps
The Network to Freedom and the House Divided Project have partnered on a major research initiative about Slave Stampedes on the Southern Borderlands, documenting attempted large group escapes from slavery during the period 1847 to 1865. Here are some selected maps from that effort.
Slave Stampedes, 1847 – 1865
The GIS map below details nearly 200 attempted large group escapes or slave stampedes between 1847 and 1865, as reported in US newspapers. Each dot represents a separate reported stampedes with dots sized according to estimated numbers, from a few freedom seekers to more than fifty. Dark blue dots represent a freedom outcome; light blue equals uncertain (though presumed free); purple equals mixed outcomes, and red dots equal stampedes that ended in death or capture. The dots are clickable for viewing additional data. Created by Cooper H. Wingert.
The custom-made Google map below visualizes newspaper coverage of slave stampedes from 1856 to 1860 with direct links inside the place marks to the articles. Created by staff and students from the House Divided Project.
Missouri Escapes, 1840 – 1865
As part of the Slave Stampedes research initiative, the project staff also gathered data concerning individual escapes from the state of Missouri, relying mainly on runaway ads. This GIS map created by Cooper H. Wingert visualizes more than 300 escapes, including nearly two dozen slave stampedes or group escapes, between 1840 and 1865. Dot size and shape correspond to numbers and outcomes. The dots are clickable for viewing additional data.
1850 Fugitive Slave Act
This GIS map and original dataset created by Cooper Wingert visualizes arrests under the federal 1850 Fugitive Slave Act. The dataset originally appeared in Cooper Wingert, “Fugitive Slave Renditions and the Proslavery Crisis of Confidence in Federalism, 1850-1860,” Journal of American History 110, no. 1 (June 2023): 40-57.