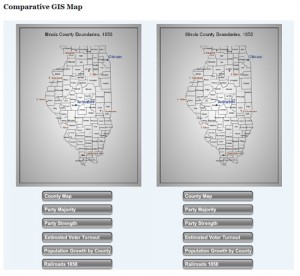
Geographic Information System (GIS) maps are becoming a common tool in academic history and offer an especially useful way to analyze Lincoln and the Civil War era. Whether in political or military history of the period, the ability to generate dynamic maps from wide-ranging data is essential. Here are some examples of maps relevant to the Lincoln-Douglas campaign of 1858, animated by Adobe Flash software to allow users to select their own layers for analysis. The data for these maps comes from Illinois State Archives election returns for 1858 and the U.S. Census in Illinois from 1850 and 1860. Party majority and party strength results are based upon returns for the 1858 state treasurer’s race –the most important statewide race on the ballot in the fall of that year. The Lincoln-Douglas campaign was actually attempting to influence legislative elections on a district-by-district basis since legislatures, not people, still selected U.S. senators in those days. The turnout figures have been estimated by comparing the total vote for state treasurer with the adult white male population on a county-by-county basis.


Leave a Reply